








Know the benefits of demat account
Free Demat account in minutes | Low brokerage | Online account opening
A displaced moving average calculates the average price over a selected period and then shifts the line by a chosen number of bars.
- A positive displacement moves the line forward.
- A negative displacement moves it backward.
- DMA may help identify trends and dynamic support or resistance.
- The shift changes the line’s position, not the price data used.
- DMA is based on past prices and may give delayed or false signals.
- It should be used with price action, other indicators, and risk management.
What is DMA in the stock market?
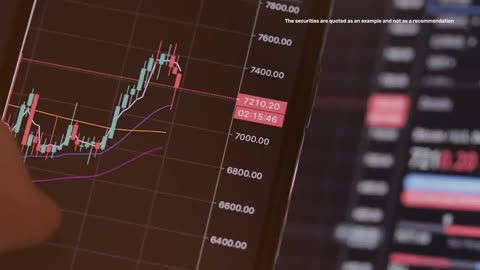
What are moving average trading strategy?
DMA, or displaced moving average, is a technical indicator used to study price patterns. It calculates the average price of a stock over a chosen period and shifts the resulting line forward or backward on the chart.
For example, a trader may calculate a 15-day moving average and shift it five bars forward. The average remains based on the same 15 days of price data, but its position on the chart changes.
The displacement helps traders compare the moving average with different parts of the price movement. However, it does not make the indicator predictive or remove its natural lag.
Why is DMA used in the stock market?
Traders mainly use DMA to study market trends and possible support or resistance levels.
When the price stays above a rising DMA, it may indicate an upward trend. When the price remains below a falling DMA, it may suggest a downward trend.
DMA may also act as dynamic support or resistance. For example, if a rising stock repeatedly falls towards the DMA and then recovers, the line may be acting as support.
DMA is usually used with other technical indicators and price-analysis tools. It should not be used alone because market conditions can affect the accuracy of its signals.
Current IPO










How does DMA work?
DMA first calculates the average price of a stock over a selected period. It then shifts the moving-average line by a chosen number of bars.
- A positive value moves the line forward.
- A negative value moves the line backward.
- A zero value leaves the moving average in its normal position.
For example, a 20-day moving average with a displacement of five uses the same 20-day calculation but appears five bars away from its original position.
The shift may help traders align the moving average with price swings or trend movements. It does not change the historical prices used in the calculation.
What is a DMA example?
Suppose you calculate a 15-day moving average using the closing prices of the previous 15 trading days.
You can then apply different displacement values:
- Positive 5 shifts the line five bars forward.
- Negative 5 shifts the line five bars backward.
- Zero displays a normal 15-day moving average.
The displacement only changes where the line appears on the chart. It does not change how the 15-day average is calculated.
What does DMA tell you?
DMA may provide information about trends and possible support or resistance. Its meaning depends on the displacement setting, market conditions, and price behaviour.
Market trends
A rising DMA with the price staying above it may indicate an uptrend. A falling DMA with the price staying below it may indicate a downtrend.
However, one move above or below the line does not always confirm a new trend. Traders usually look for confirmation from price action or other indicators.
Support and resistance
DMA may behave like a moving support or resistance level.
For example, if the price repeatedly falls towards the DMA and then rises, the line may act as support. If the price rises towards the DMA and then falls, the line may act as resistance.
Start investing today

Open Demat Account
Open Trading Account

Margin Trading Facility
Displaced moving average (DMA) vs. exponential moving average (EMA)
DMA and EMA are both moving-average tools, but they describe different features.
DMA refers to a moving average shifted forward or backward on a chart. The underlying average can be a simple moving average, exponential moving average, or another type.
EMA gives greater weight to recent prices. As a result, it reacts faster to current price changes than a simple moving average of the same period.
1. Calculation methodology
EMA uses a formula that gives more importance to recent price data and less importance to older prices.
DMA mainly refers to the displacement of a moving-average line. For example, traders can use a displaced simple moving average or a displaced exponential moving average.
2. Time lag
Both DMA and EMA use historical prices, so both have some lag.
EMA generally reacts faster because it gives more weight to recent prices. However, it does not remove lag completely.
Shifting a moving average changes its visual position. It does not turn it into a forecasting tool.
3. Smoothing effect
Both indicators smooth short-term price movements and help show the broader trend.
The smoothing effect of DMA depends on the type and period of the underlying moving average. A longer period normally produces a smoother but slower line.
EMA reacts more quickly than a simple moving average of the same length. However, this can also make it more sensitive to short-term price changes.
4. Areas of use
DMA may be used to study trends, price cycles, and dynamic support or resistance.
EMA is commonly used for trend analysis, moving-average crossovers, momentum changes, and short-term trading setups.
Neither indicator should be treated as a complete trading signal on its own.
Upcoming IPO





What are the pros and cons of DMA trading?
DMA can make market trends easier to study, but it also has limitations.
Pros of DMA trading
1. It supports price analysis
DMA helps traders compare the current price with a shifted moving-average line. This may make trends and repeating price patterns easier to observe.
2. It can support options trading strategies
DMA can be combined with volume, price action, chart patterns, and other indicators when studying options trading strategies.
For example, a price bounce from the DMA may be more meaningful when trading volume also increases.
3. It may help identify trends
A rising DMA with prices above it may support an uptrend view. A falling DMA with prices below it may support a downtrend view.
However, the signal depends on the selected period and displacement value.
Cons of DMA trading
1. It is not always reliable
DMA cannot identify every trend reversal or support and resistance level correctly.
Because it uses past prices, signals may appear after a price movement has already started.
2. Time lag may delay signals
Moving averages naturally react after prices change.
For example, a stock may already have fallen sharply before the DMA begins to turn downward. This can delay trading decisions.
3. It cannot be used alone
Using only DMA may lead to false signals or incorrect trend readings.
Traders usually combine it with price action, volume, chart patterns, or other indicators.
Features and Benefits of LAS

Tenure 36 months
Flexible repayment from 7 days to 36 months

1000+ shares
Get 50% value on 1000+ shares

All DP shares available
All companies’ and DPs’ Demat accounts accepted for loans

Customer portal
Handle loans, shares, and statements — all in one place
What are the limitations of a displaced moving average?
DMA has several limitations that traders should understand.
1. Time lag
DMA is based on historical prices. Therefore, it may react after the market has already moved.
Shifting the line does not remove this delay.
2. Subjectivity in displacement
There is no single displacement value suitable for every market or timeframe.
For example, one trader may use a displacement of five periods, while another may use ten. Both may receive different visual signals from the same chart.
3. False signals in sideways markets
DMA may give repeated false signals when prices move within a narrow range.
The price may cross above and below the DMA several times without forming a clear trend.
4. Risk of over-reliance
DMA only reflects historical price information. It does not directly consider economic events, company updates, market demand, or investor sentiment.
Relying too heavily on DMA without using price action, other indicators, or fundamental analysis may lead to poor decisions.
5. Limited use in volatile markets
In highly volatile or choppy markets, DMA may provide confusing signals.
Its smoothing effect may hide sudden movements, while repeated crossings may make the trend difficult to interpret.
What should you remember while using DMA in the stock market?
Keep the natural time lag of moving averages in mind when reading DMA signals.
Choose the moving-average period and displacement value according to your timeframe, strategy, and market conditions.
Use DMA with price action, volume, chart patterns, or other indicators for confirmation.
Avoid repeatedly changing the settings only to match past price movements. A setting that works on historical data may not work in future conditions.
Back-test the DMA strategy using past market data before applying it to live trades.
Use risk-management measures such as position sizing and stop-loss orders. These methods can help control risk but cannot prevent every loss.
- Avoid making emotional decisions based only on the price crossing the DMA line.
Conclusion
A displaced moving average can help traders study price trends, possible support and resistance levels, and changes in market direction. However, it is based on historical prices and may produce delayed or false signals, especially in sideways or volatile markets. Its usefulness depends on the selected period and displacement value. Traders should combine DMA with price action, volume, other indicators, and fundamental analysis. Proper risk management is also important when using DMA for options trading or other strategies.
Top Investment Options for You





Related Articles

Frequently Asked Questions
Displaced Moving Average (DMA)
What is the full form of DMA in the stock market?
DMA stands for Displaced Moving Average. It is a technical indicator that calculates the average price of a stock over a selected period and shifts the resulting line forward or backwards on the chart. Traders use DMA to study trends, price movements, and possible support or resistance levels. The displacement changes the line’s position but does not change the price data used in the calculation.
How does DMA differ from other moving averages?
DMA differs from regular moving averages because its line is shifted forward or backward by a chosen number of periods. A standard moving average remains in its original position on the chart. DMA can use a simple, exponential, or another moving average as its base. In comparison, an exponential moving average gives greater weight to recent prices and reacts more quickly to price changes.
Is DMA used independently for trading decisions?
DMA should not be used independently for trading decisions because it is based on historical price data and may produce delayed or false signals. You can combine it with price action, trading volume, chart patterns, fundamental analysis, and other technical indicators. Using different sources of information may provide a broader view, but no combination of indicators can guarantee an accurate signal or prevent trading losses.
What are the key limitations of DMA in the stock market?
The main limitations of DMA include time lag, subjective displacement settings, and false signals in sideways or volatile markets. Since DMA uses historical prices, it may react after the market has already moved. Different traders may also select different periods and displacement values. DMA does not directly consider economic events, company updates, market sentiment, or other factors covered through fundamental analysis.
How can traders minimise the risks that come with DMA?
Traders can reduce DMA-related risks by confirming its signals through price action, volume, chart patterns, and other indicators. They should select the calculation period and displacement value according to their timeframe and test the settings using historical data. Proper position sizing and stop-loss orders may help control potential losses. Traders should also avoid changing DMA settings only to make them match past market movements.
Disclaimer
Investments in the securities market are subject to market risk, read all related documents carefully before investing.
Broking services offered by Bajaj Financial Securities Limited (Bajaj Broking). Reg Office: Bajaj Auto Limited Complex, Mumbai –Pune Road Akurdi Pune 411035. Corporate Office: Bajaj Financial Securities Limited, 1st Floor, Mantri IT Park, Tower B, Unit No 9 & 10, Viman Nagar, Pune, Maharashtra 411014. SEBI Registration No.: INZ000218931 | BSE Cash/F&O/CDS (Member ID:6706) | NSE Cash/F&O/CDS (Member ID: 90177) | MCX (Member ID: 57680) | DP registration No: IN-DP-418-2019 | CDSL DP No.: 12088600 | NSDL DP No. IN304300 | AMFI Registration No.: ARN –163403.
Details of Compliance Officer: Mr. Harinatha Reddy Muthumula (For Broking/DP/Research) | Email: compliance_sec@bajajbroking.in | Contact No.: 020-4857 4486. For any investor grievances write to compliance_sec@bajajbroking.in/ compliance_dp@bajajbroking.in (DP related)
This content is for educational purpose only. Securities quoted are exemplary and not recommendatory.
Research Services are offered by Bajaj Broking as Research Analyst under SEBI Regn: INH000010043.
For more disclaimer, check here: https://www.bajajbroking.in/disclaimer