












Invest in equities, F&O and upcoming IPOs effortlessly by opening a demat account online. Enjoy a free subscription for the first year with Bajaj Broking

Know the benefits of a demat account
Check now
Free Demat account in minutes | Low brokerage | Online account opening
The Hull Moving Average (HMA) helps traders identify whether prices are moving up or down more quickly than traditional moving averages. It gives more importance to recent price movements, making it easier to spot potential trend changes while reducing unnecessary market fluctuations.
Key highlights
- HMA full form: Hull Moving Average
- Developed by: Alan Hull
- Introduced in: 2005
- Main purpose: Identify market trends faster by reducing the lag found in traditional moving averages
- How it works: Combines multiple Weighted Moving Averages (WMAs) and applies square-root smoothing to produce a smoother indicator
- Common settings: 9–12 for short-term trading, 16 (default), 21 for swing trading, and 50 or higher for long-term trend analysis
- Used for: Analysing trends in equities, derivatives, commodities, forex, and other financial markets
Show More
Show Less
What is Hull Moving Average (HMA)?
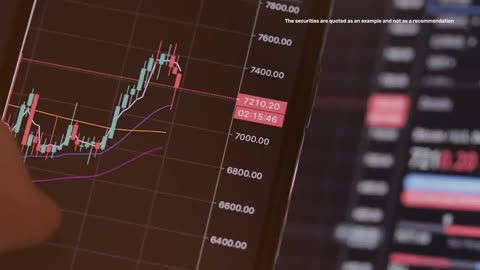
What are moving average trading strategy?
The Hull Moving Average (HMA) is a technical indicator that helps traders identify market trends more quickly. It reduces the delay found in traditional moving averages, making it easier to spot changes in price while filtering out some short-term market noise.
Alan Hull developed the HMA in 2005 to solve a common problem. Many moving averages react too slowly to price changes, while faster ones often give too many false signals. The Hull Moving Average aims to provide faster signals without making the indicator too noisy.
Unlike the Simple Moving Average (SMA), which gives equal importance to all prices in the selected period, the HMA gives more weight to recent prices. This helps it respond more quickly when the market changes direction.
For example, imagine a stock trades at nearly the same price for several days and then suddenly rises. The SMA may take time to reflect the new trend because it still includes older prices. The HMA usually adjusts faster, helping traders identify the change earlier.
Quick facts
| Feature | Details |
| HMA full form | Hull Moving Average |
| Developed by | Alan Hull |
| Introduced | 2005 |
| Indicator type | Trend-following moving average |
| Main advantage | Reduced lag with smoother signals |
Show More
Show Less
Current IPO
Mainboard
SME
Why do traders use the Hull Moving Average?
Traders use the Hull Moving Average because it reacts faster to price changes while maintaining a smoother trend line. This balance helps reduce delayed trading signals without making the indicator overly sensitive.
Traditional moving averages often continue pointing in the previous direction even after the market has changed. The HMA aims to minimise this delay by assigning greater importance to recent prices and applying a unique smoothing method.
The Hull Moving Average can help traders:
- Identify new market trends earlier
- Recognise potential trend reversals
- Filter out some short-term market fluctuations
- Improve the timing of entries and exits
- Support trend-following trading strategies
For example, suppose a stock trades between ₹950 and ₹980 for several days before suddenly moving to ₹1,030 after a strong earnings announcement. A traditional moving average may take several sessions to reflect this move. The HMA generally responds sooner because it focuses more on recent price data.
Show More
Show Less
Hull Moving Average formula
The Hull Moving Average (HMA) reduces the delay found in traditional moving averages by combining multiple Weighted Moving Averages (WMAs). This helps it respond more quickly to price changes while keeping the trend line smooth.
Hull Moving Average formula
HMA(n) = WMA [2 × WMA(n/2) − WMA(n)], √n
| Term | Meaning |
| HMA | Hull Moving Average |
| WMA | Weighted Moving Average |
| n | Selected time period |
| √n | Square root of the selected period |
The Hull formula works in three simple steps. First, it calculates two Weighted Moving Averages—one using half of the selected period and another using the full period. Next, it gives more importance to the shorter-period WMA by doubling it and then subtracts the longer-period WMA. Finally, it applies one more Weighted Moving Average using the square root of the selected period.
Show More
Show Less
Start investing today

Open Demat Account
Open Trading Account

Margin Trading Facility
Why do traditional moving averages lag?
Traditional moving averages lag because they depend on past prices to calculate the average. When the market changes direction quickly, these older prices continue to influence the calculation, causing the indicator to react more slowly than the actual price.
For example, consider the following 10-day closing prices of a hypothetical NSE-listed stock.
| Day | Closing price |
| 1 | ₹100 |
| 2 | ₹98 |
| 3 | ₹97 |
| 4 | ₹102 |
| 5 | ₹101 |
| 6 | ₹103 |
| 7 | ₹99 |
| 8 | ₹95 |
| 9 | ₹98 |
| 10 | ₹104 |
The 10-day Simple Moving Average (SMA) is:
(100 + 98 + 97 + 102 + 101 + 103 + 99 + 95 + 98 + 104) ÷ 10 = ₹99.70
Now assume the stock closes at ₹120 on Day 11.
The oldest price (₹ 100) drops out of the calculation, and the new average becomes:
(98 + 97 + 102 + 101 + 103 + 99 + 95 + 98 + 104 + 120) ÷ 10 = ₹101.70
Although the price increased sharply from ₹104 to ₹120, the SMA moved by only ₹2. This delay is known as lag.
The Exponential Moving Average (EMA) reduces lag by assigning more weight to recent prices. However, it can still react slowly during sudden market reversals.
The Weighted Moving Average (WMA) responds even faster because it gives higher weight to the latest prices. However, this higher sensitivity can produce more short-term fluctuations and false signals.
The Hull Moving Average combines the advantages of these indicators. It reduces lag like a WMA while maintaining a smoother line that is easier to interpret.
Comparison of moving averages
| Indicator | Lag | Smoothness | Best for |
| SMA | High | High | Long-term trend analysis |
| EMA | Medium | Medium | Short-term trend signals |
| WMA | Low | Low | Recent price movements |
| HMA | Very low | High | Fast trend identification across timeframes |
Show More
Show Less
How to set up the Hull Moving Average?
Setting up the Hull Moving Average involves choosing a suitable period, selecting the appropriate chart timeframe, and understanding how different settings affect trading signals.
Choose the right period
The selected period determines how sensitive the indicator is to price movements.
| HMA period | Common use |
| 9–12 | Short-term trading |
| 16 | Default setting suggested by Alan Hull |
| 21 | Swing trading |
| 50+ | Long-term trend analysis |
A shorter period reacts faster but may generate more false signals. A longer period produces smoother signals but reacts more slowly to market changes.
2. Select a suitable timeframe
Different trading styles require different chart timeframes.
- 1–5-minute charts: Scalping
- 15–30-minute charts: Intraday trading
- Daily charts: Swing trading
- Weekly charts: Long-term investing
For example, a swing trader analysing a banking stock may prefer a 21-period HMA on the daily chart, while an intraday trader may use a 16-period HMA on a 15-minute chart.
3. Add the indicator
Most charting platforms include the Hull Moving Average as a built-in indicator.
If you are using the HMA for the first time, the default 16-period setting provides a good starting point.
Show More
Show Less
Upcoming IPO
Mainboard
SME
Aarvee Engineering Consultants Limited
Bidding
To
be announced
Price
To be announced
Absolute Project India Limited
Bidding
To
be announced
Price
To be announced
AceVector Limited
Bidding
To
be announced
Price
To be announced
Adroit Industries India Limited
Bidding
To
be announced
Price
To be announced
Advanced SysTek Limited
Bidding
To
be announced
Price
To be announced
What are the advantages and limitations of the Hull Moving Average?
Like every technical indicator, the Hull Moving Average has strengths and limitations.
| Advantages | Limitations |
| Reduces lag compared with SMA and EMA | May generate false signals during sideways markets |
| Produces a smoother trend line | Sensitive to sudden price spikes |
| Works across different markets and timeframes | Manual calculation is relatively complex |
| Easy to interpret through the slope of the indicator | Should not be used as a standalone trading signal |
| Supports trend-following, breakout, and reversal strategies | Requires confirmation from other indicators |
Best practice
Many swing traders use a 21-period HMA on the daily chart and combine it with the 14-period Relative Strength Index (RSI) and trading volume to confirm momentum before making trading decisions.
Remember that technical indicators support analysis but cannot eliminate market risk.
Conclusion
The Hull Moving Average (HMA) is a technical indicator designed to identify market trends with less lag than many traditional moving averages. It combines multiple Weighted Moving Averages and square-root smoothing to provide faster yet smoother trend signals.
Although the HMA can improve trend analysis, it does not predict future price movements with certainty. Combining the Hull Moving Average with price action, momentum indicators, trading volume, and appropriate risk management can help traders make more informed decisions.
Features and Benefits of LAS

Tenure 36 months
Flexible repayment from 7 days to 36 months

1000+ shares
Get 50% value on 1000+ shares

All DP shares available
All companies’ and DPs’ Demat accounts accepted for loans

Customer portal
Handle loans, shares, and statements — all in one place
Pro Tip

Top Investment Options for You





Related Articles



Frequently Asked Questions
Hull Moving Average
What is the best setting for the Hull Moving Average?
The most commonly used Hull Moving Average setting is 16 periods, as suggested by Alan Hull. However, many traders use 9–12 periods for short-term trading, 21 periods for swing trading, and 50 or more periods for identifying long-term market trends. The ideal setting depends on your trading style and timeframe.
Which indicator works best with the Hull Moving Average?
The Hull Moving Average often works well alongside indicators such as the Relative Strength Index (RSI), Moving Average Convergence Divergence (MACD), and trading volume. These indicators can help confirm trend strength and reduce the likelihood of acting on false signals. Using multiple indicators may improve analysis, but it does not eliminate market risk.
How do you interpret the Hull Moving Average line?
A rising Hull Moving Average generally indicates an upward trend, while a falling HMA suggests a downward trend. A flat HMA often indicates a range-bound market. Traders usually interpret the HMA together with price action rather than relying on the indicator alone.
Disclaimer
Standard Disclaimer
Investments in the securities market are subject to market risk, read all related documents carefully before investing.
Broking services offered by Bajaj Financial Securities Limited (Bajaj Broking). Reg Office: Bajaj Auto Limited Complex, Mumbai –Pune Road Akurdi Pune 411035. Corporate Office: Bajaj Financial Securities Limited, 1st Floor, Mantri IT Park, Tower B, Unit No 9 & 10, Viman Nagar, Pune, Maharashtra 411014. SEBI Registration No.: INZ000218931 | BSE Cash/F&O/CDS (Member ID:6706) | NSE Cash/F&O/CDS (Member ID: 90177) | DP registration No: IN-DP-418-2019 | CDSL DP No.: 12088600 | NSDL DP No. IN304300 | AMFI Registration No.: ARN –163403.
Details of Compliance Officer: Mr. Boudhayan Ghosh (For Broking/DP/Research) | Email: compliance_sec@bajajbroking.in | Contact No.: 020-4857 4486. For any investor grievances write to compliance_sec@bajajbroking.in/ compliance_dp@bajajbroking.in (DP related)
This content is for educational purpose only. Securities quoted are exemplary and not recommendatory.
Research Services are offered by Bajaj Broking as Research Analyst under SEBI Regn: INH000010043.
For more disclaimer, check here: https://www.bajajbroking.in/disclaimer